Hello, thank you in advance for any help, long time user, first request for help. I have New HP I5 laptop, Windows 10, DirectX 12, 12GB Ram, VDJ (64bit), Phase MWM (updated) and I keep getting signal distortion in both VDJ and Serato Dj Pro.
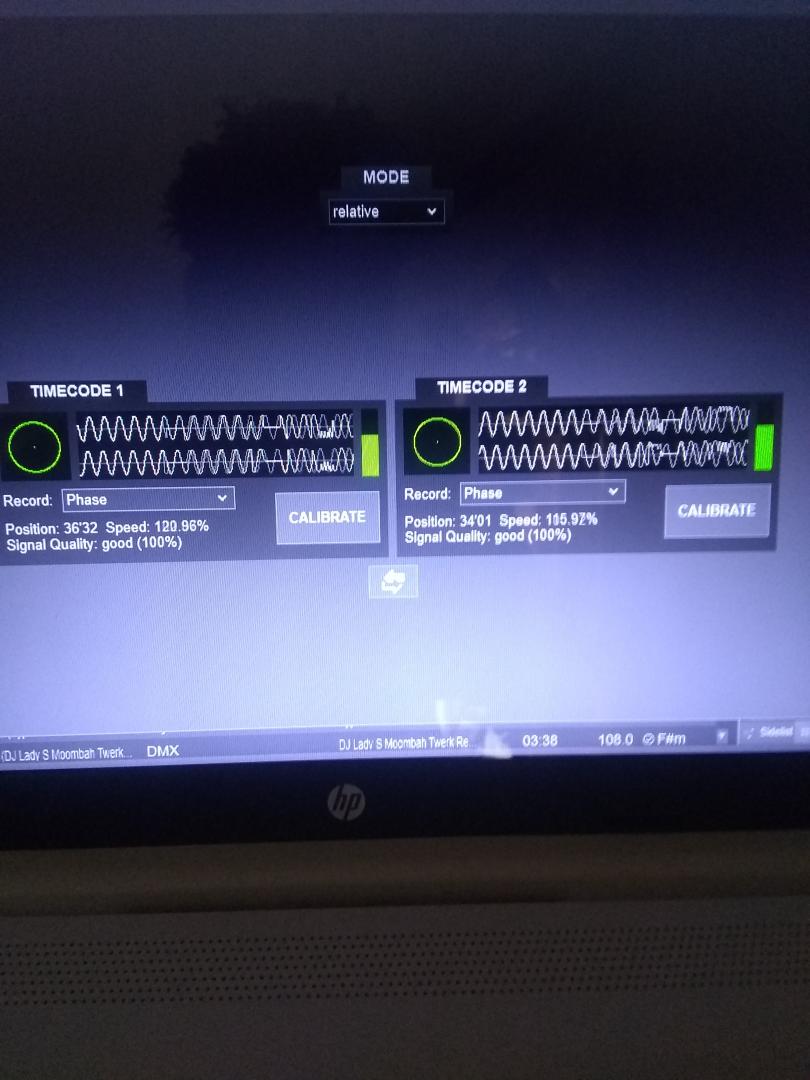
I have "new" cables arriving from MWM and ordered a 2nd set that are 22AWG and I believe shielded. I've tried mutliple setting changes as viewed on YouTube and within this Community and can not figure it out. I don't have confidence at this time to take on additional work because of these issues. I've tried switching between internal mode then back, I tried going back to Timecode Vinyl, I tried both VDJ and Serato Timecode signals within Phase, I tried adjusting buffers, etc...
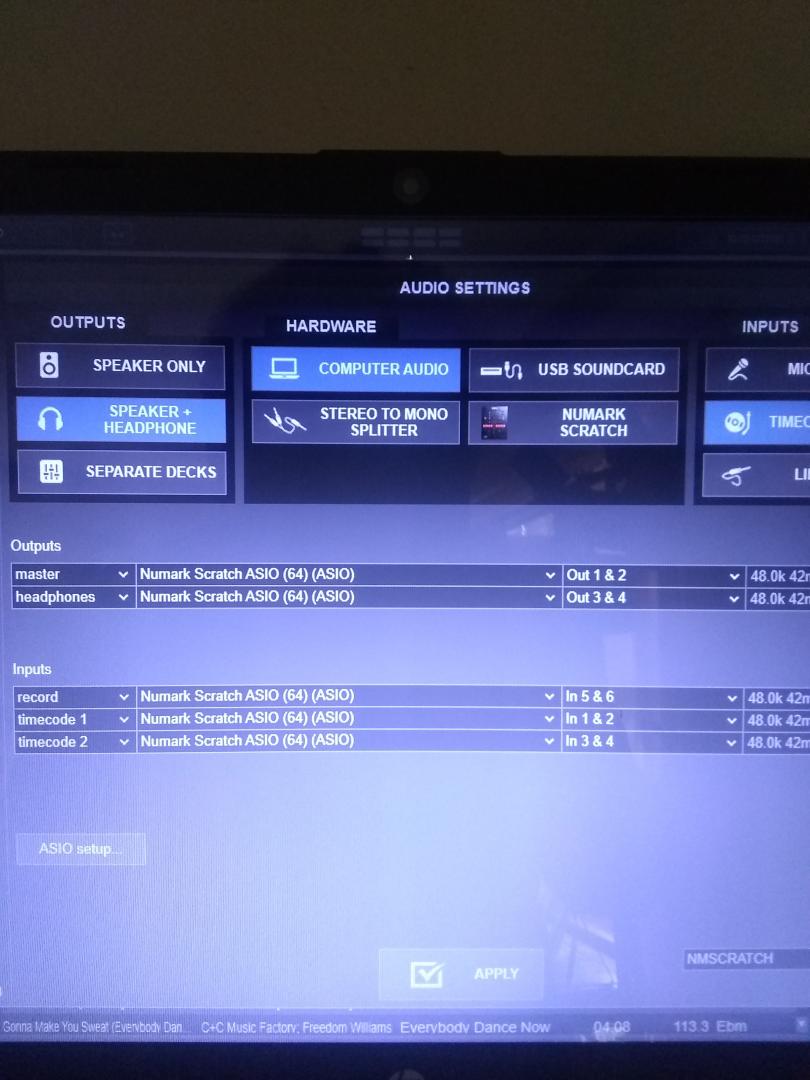
I am also having issue that the Audio Settings does not stay on Numark Scratch but goes to Computer Audio. When I click on the ASIO Setup button, it takes me to the buffer adjustment for the Numark Scratcvh downloaded from the Numark website.
Serato Dj Pro distortion.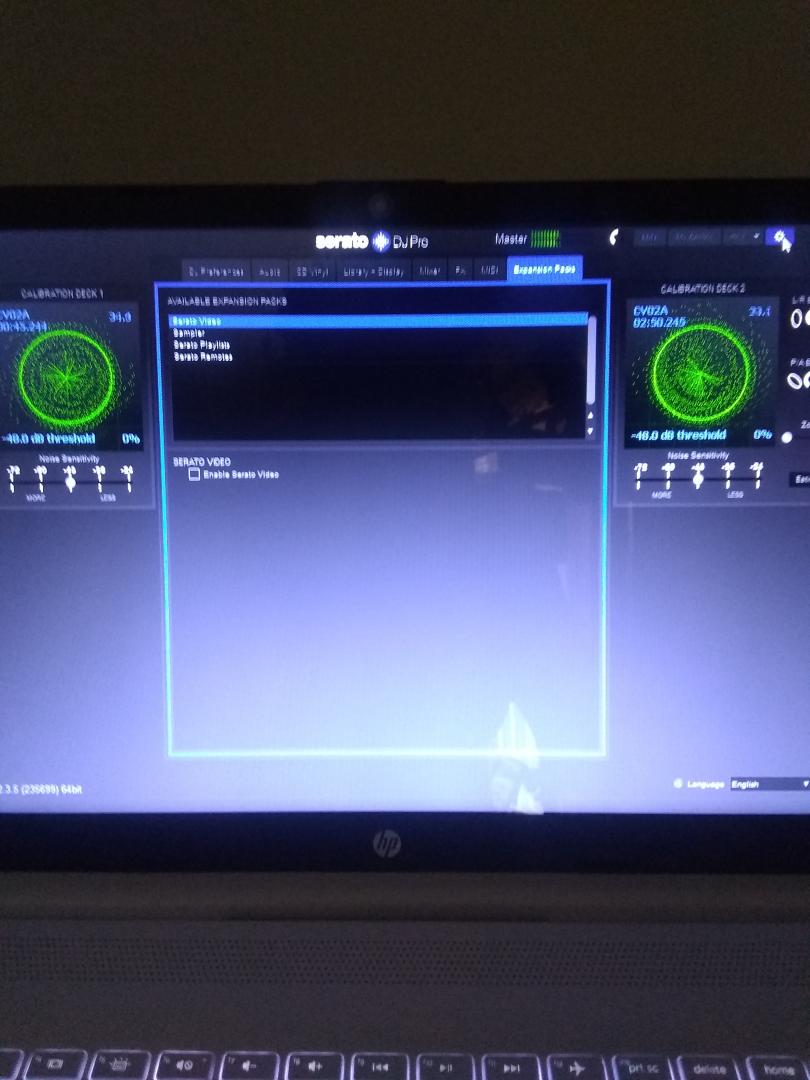
Please help!

I have "new" cables arriving from MWM and ordered a 2nd set that are 22AWG and I believe shielded. I've tried mutliple setting changes as viewed on YouTube and within this Community and can not figure it out. I don't have confidence at this time to take on additional work because of these issues. I've tried switching between internal mode then back, I tried going back to Timecode Vinyl, I tried both VDJ and Serato Timecode signals within Phase, I tried adjusting buffers, etc...
I am also having issue that the Audio Settings does not stay on Numark Scratch but goes to Computer Audio. When I click on the ASIO Setup button, it takes me to the buffer adjustment for the Numark Scratcvh downloaded from the Numark website.

Serato Dj Pro distortion.

Please help!
geposted Sun 31 May 20 @ 1:44 pm
Something is distorting indeed, but doubt its the cables,
Just a wild guess, have you tried turning off bluetooth (if enabled) and/or run your laptop on battery?
Just a wild guess, have you tried turning off bluetooth (if enabled) and/or run your laptop on battery?
geposted Sun 31 May 20 @ 2:12 pm
djdad wrote :
...tried turning off bluetooth (if enabled) and/or run your laptop on battery?
Are they actual known issues with phase? [and is that just your machine BT?] I was thinking about getting phase but battery only use makes it unfit for purpose, BT not so much.
geposted Sun 31 May 20 @ 2:40 pm
no, nothing to do with Phase. Actually turning off Bluetooth ts for the Numark Scratch, just in case it suffers from an old driver conflict some models had.
But still those were some blind guesses clearly for troubleshooting.
Another test of course would be to try a different DVS mixer/card
But still those were some blind guesses clearly for troubleshooting.
Another test of course would be to try a different DVS mixer/card
geposted Sun 31 May 20 @ 4:30 pm
Thanks all for the input, I tried all of it, turning off Wi-fi, Bluetooth, installing ASIO4All, I'm honestly considering selling the Phase as it's not what I was expecting, however I sold all of my Shure needles to purchase this, so I likely will purchase the Ortofon MK2 Needles or sell my gear and get a Controller. Disheartened that I cant make it work smoothly like I see other celebrity and lesser know Dj's use the system. I know they're coming out with the HID mode for Serato, but honestly I favor VDJ over Serato and do not want to spend time trying to learn the software.
geposted Sun 31 May 20 @ 5:59 pm
I thought u said you tried Timecode , (timecode vinyl) and was the same, no ?
If so perhaps ithe Scratch inputs ?
If so perhaps ithe Scratch inputs ?
geposted Sun 31 May 20 @ 6:51 pm
Djdad, thank you for the feedback. Yes, I've tried a switch back to Serato Timecode CV02 with Audio Technica needles that I had and I experienced the same issue, with that said I assume it may be the program. I've had Phase from the beginning, but have not gigged a full set with it. I'm not confident that the system will be clean through the event. I am going to try a hard reset and see what happens...
geposted Sun 31 May 20 @ 11:59 pm
You are feeding the outputs of the Phase receiver into line inputs on the Scratch?
geposted Mon 01 Jun 20 @ 7:38 am
You could also try your computer's line input if available to see if the issue is with the numark scratch
geposted Mon 01 Jun 20 @ 9:39 am
Thanks all for your input. The Numark Scratch has one two (2) sets of line/phono plugs for RCA with a switch to go to line vs phono; they're set to line.
https://www.numark.com/images/sized/images/product_large/SCRATCH_rear_2400x1500-624x390.jpg
I reinstalled MWM Connect last night and performed both a soft reset and a hard reset, issue remained. I am going to remove & reinstall VDJ today and see what happens.
Still open to suggestions...
https://www.numark.com/images/sized/images/product_large/SCRATCH_rear_2400x1500-624x390.jpg
I reinstalled MWM Connect last night and performed both a soft reset and a hard reset, issue remained. I am going to remove & reinstall VDJ today and see what happens.
Still open to suggestions...
geposted Mon 01 Jun 20 @ 12:20 pm
Do you only have the Numark Scratch mixer or do you have another mixer with a built in sound card that you can try out? If you have a different mixer you can swap out, then that will tell you it's not a Phase issue and more of a mixer. I use Phase with a Pioneer S9 and don't have any distortion what so ever. It's a 100% clean signal, both with VDJ and Serato.
BTW, what turntables are you using with this?
BTW, what turntables are you using with this?
geposted Tue 02 Jun 20 @ 1:06 pm
Hello all, I ran LatencyMon on my laptop and this is what I received:
_________________________________________________________________________________________________________
CONCLUSION
_________________________________________________________________________________________________________
Your system appears to be having trouble handling real-time audio and other tasks. You are likely to experience buffer underruns appearing as drop outs, clicks or pops. One or more DPC routines that belong to a driver running in your system appear to be executing for too long. One problem may be related to power management, disable CPU throttling settings in Control Panel and BIOS setup. Check for BIOS updates.
LatencyMon has been analyzing your system for 0:22:08 (h:mm:ss) on all processors.
_________________________________________________________________________________________________________
SYSTEM INFORMATION
_________________________________________________________________________________________________________
Computer name: LAPTOP-F7V5NLR9
OS version: Windows 10 , 10.0, build: 18363 (x64)
Hardware: HP Laptop 15t-dy100, HP, 86C9
CPU: GenuineIntel Intel(R) Core(TM) i5-1035G1 CPU @ 1.00GHz
Logical processors: 8
Processor groups: 1
RAM: 12041 MB total
_________________________________________________________________________________________________________
CPU SPEED
_________________________________________________________________________________________________________
Reported CPU speed: 1190 MHz
Note: reported execution times may be calculated based on a fixed reported CPU speed. Disable variable speed settings like Intel Speed Step and AMD Cool N Quiet in the BIOS setup for more accurate results.
WARNING: the CPU speed that was measured is only a fraction of the CPU speed reported. Your CPUs may be throttled back due to variable speed settings and thermal issues. It is suggested that you run a utility which reports your actual CPU frequency and temperature.
_________________________________________________________________________________________________________
MEASURED INTERRUPT TO USER PROCESS LATENCIES
_________________________________________________________________________________________________________
The interrupt to process latency reflects the measured interval that a usermode process needed to respond to a hardware request from the moment the interrupt service routine started execution. This includes the scheduling and execution of a DPC routine, the signaling of an event and the waking up of a usermode thread from an idle wait state in response to that event.
Highest measured interrupt to process latency (µs): 7860.30
Average measured interrupt to process latency (µs): 10.645716
Highest measured interrupt to DPC latency (µs): 7821.90
Average measured interrupt to DPC latency (µs): 3.22890
_________________________________________________________________________________________________________
REPORTED ISRs
_________________________________________________________________________________________________________
Interrupt service routines are routines installed by the OS and device drivers that execute in response to a hardware interrupt signal.
Highest ISR routine execution time (µs): 571.095798
Driver with highest ISR routine execution time: ACPI.sys - ACPI Driver for NT, Microsoft Corporation
Highest reported total ISR routine time (%): 0.041472
Driver with highest ISR total time: Wdf01000.sys - Kernel Mode Driver Framework Runtime, Microsoft Corporation
Total time spent in ISRs (%) 0.042628
ISR count (execution time <250 µs): 2237969
ISR count (execution time 250-500 µs): 0
ISR count (execution time 500-999 µs): 40
ISR count (execution time 1000-1999 µs): 0
ISR count (execution time 2000-3999 µs): 0
ISR count (execution time >=4000 µs): 0
_________________________________________________________________________________________________________
REPORTED DPCs
_________________________________________________________________________________________________________
DPC routines are part of the interrupt servicing dispatch mechanism and disable the possibility for a process to utilize the CPU while it is interrupted until the DPC has finished execution.
Highest DPC routine execution time (µs): 3853.598319
Driver with highest DPC routine execution time: Wdf01000.sys - Kernel Mode Driver Framework Runtime, Microsoft Corporation
Highest reported total DPC routine time (%): 0.761210
Driver with highest DPC total execution time: Wdf01000.sys - Kernel Mode Driver Framework Runtime, Microsoft Corporation
Total time spent in DPCs (%) 0.823047
DPC count (execution time <250 µs): 5512346
DPC count (execution time 250-500 µs): 0
DPC count (execution time 500-999 µs): 5481
DPC count (execution time 1000-1999 µs): 1
DPC count (execution time 2000-3999 µs): 281
DPC count (execution time >=4000 µs): 0
_________________________________________________________________________________________________________
REPORTED HARD PAGEFAULTS
_________________________________________________________________________________________________________
Hard pagefaults are events that get triggered by making use of virtual memory that is not resident in RAM but backed by a memory mapped file on disk. The process of resolving the hard pagefault requires reading in the memory from disk while the process is interrupted and blocked from execution.
NOTE: some processes were hit by hard pagefaults. If these were programs producing audio, they are likely to interrupt the audio stream resulting in dropouts, clicks and pops. Check the Processes tab to see which programs were hit.
Process with highest pagefault count: microsoft.photos.exe
Total number of hard pagefaults 2745
Hard pagefault count of hardest hit process: 1630
Number of processes hit: 23
_________________________________________________________________________________________________________
PER CPU DATA
_________________________________________________________________________________________________________
CPU 0 Interrupt cycle time (s): 192.369334
CPU 0 ISR highest execution time (µs): 364.676471
CPU 0 ISR total execution time (s): 4.390349
CPU 0 ISR count: 2234924
CPU 0 DPC highest execution time (µs): 3853.598319
CPU 0 DPC total execution time (s): 83.983974
CPU 0 DPC count: 5182006
_________________________________________________________________________________________________________
CPU 1 Interrupt cycle time (s): 128.824142
CPU 1 ISR highest execution time (µs): 571.095798
CPU 1 ISR total execution time (s): 0.110169
CPU 1 ISR count: 2017
CPU 1 DPC highest execution time (µs): 927.660504
CPU 1 DPC total execution time (s): 1.840566
CPU 1 DPC count: 85394
_________________________________________________________________________________________________________
CPU 2 Interrupt cycle time (s): 109.846842
CPU 2 ISR highest execution time (µs): 311.825210
CPU 2 ISR total execution time (s): 0.028665
CPU 2 ISR count: 1068
CPU 2 DPC highest execution time (µs): 656.609244
CPU 2 DPC total execution time (s): 0.159966
CPU 2 DPC count: 14824
_________________________________________________________________________________________________________
CPU 3 Interrupt cycle time (s): 67.841627
CPU 3 ISR highest execution time (µs): 0.0
CPU 3 ISR total execution time (s): 0.0
CPU 3 ISR count: 0
CPU 3 DPC highest execution time (µs): 304.331092
CPU 3 DPC total execution time (s): 1.350155
CPU 3 DPC count: 214533
_________________________________________________________________________________________________________
CPU 4 Interrupt cycle time (s): 49.240377
CPU 4 ISR highest execution time (µs): 0.0
CPU 4 ISR total execution time (s): 0.0
CPU 4 ISR count: 0
CPU 4 DPC highest execution time (µs): 209.054622
CPU 4 DPC total execution time (s): 0.051137
CPU 4 DPC count: 5839
_________________________________________________________________________________________________________
CPU 5 Interrupt cycle time (s): 34.164084
CPU 5 ISR highest execution time (µs): 0.0
CPU 5 ISR total execution time (s): 0.0
CPU 5 ISR count: 0
CPU 5 DPC highest execution time (µs): 232.242857
CPU 5 DPC total execution time (s): 0.015038
CPU 5 DPC count: 7745
_________________________________________________________________________________________________________
CPU 6 Interrupt cycle time (s): 38.097940
CPU 6 ISR highest execution time (µs): 0.0
CPU 6 ISR total execution time (s): 0.0
CPU 6 ISR count: 0
CPU 6 DPC highest execution time (µs): 255.854622
CPU 6 DPC total execution time (s): 0.020803
CPU 6 DPC count: 5274
_________________________________________________________________________________________________________
CPU 7 Interrupt cycle time (s): 43.402676
CPU 7 ISR highest execution time (µs): 0.0
CPU 7 ISR total execution time (s): 0.0
CPU 7 ISR count: 0
CPU 7 DPC highest execution time (µs): 193.361345
CPU 7 DPC total execution time (s): 0.027127
CPU 7 DPC count: 2494
_________________________________________________________________________________________________________
_________________________________________________________________________________________________________
CONCLUSION
_________________________________________________________________________________________________________
Your system appears to be having trouble handling real-time audio and other tasks. You are likely to experience buffer underruns appearing as drop outs, clicks or pops. One or more DPC routines that belong to a driver running in your system appear to be executing for too long. One problem may be related to power management, disable CPU throttling settings in Control Panel and BIOS setup. Check for BIOS updates.
LatencyMon has been analyzing your system for 0:22:08 (h:mm:ss) on all processors.
_________________________________________________________________________________________________________
SYSTEM INFORMATION
_________________________________________________________________________________________________________
Computer name: LAPTOP-F7V5NLR9
OS version: Windows 10 , 10.0, build: 18363 (x64)
Hardware: HP Laptop 15t-dy100, HP, 86C9
CPU: GenuineIntel Intel(R) Core(TM) i5-1035G1 CPU @ 1.00GHz
Logical processors: 8
Processor groups: 1
RAM: 12041 MB total
_________________________________________________________________________________________________________
CPU SPEED
_________________________________________________________________________________________________________
Reported CPU speed: 1190 MHz
Note: reported execution times may be calculated based on a fixed reported CPU speed. Disable variable speed settings like Intel Speed Step and AMD Cool N Quiet in the BIOS setup for more accurate results.
WARNING: the CPU speed that was measured is only a fraction of the CPU speed reported. Your CPUs may be throttled back due to variable speed settings and thermal issues. It is suggested that you run a utility which reports your actual CPU frequency and temperature.
_________________________________________________________________________________________________________
MEASURED INTERRUPT TO USER PROCESS LATENCIES
_________________________________________________________________________________________________________
The interrupt to process latency reflects the measured interval that a usermode process needed to respond to a hardware request from the moment the interrupt service routine started execution. This includes the scheduling and execution of a DPC routine, the signaling of an event and the waking up of a usermode thread from an idle wait state in response to that event.
Highest measured interrupt to process latency (µs): 7860.30
Average measured interrupt to process latency (µs): 10.645716
Highest measured interrupt to DPC latency (µs): 7821.90
Average measured interrupt to DPC latency (µs): 3.22890
_________________________________________________________________________________________________________
REPORTED ISRs
_________________________________________________________________________________________________________
Interrupt service routines are routines installed by the OS and device drivers that execute in response to a hardware interrupt signal.
Highest ISR routine execution time (µs): 571.095798
Driver with highest ISR routine execution time: ACPI.sys - ACPI Driver for NT, Microsoft Corporation
Highest reported total ISR routine time (%): 0.041472
Driver with highest ISR total time: Wdf01000.sys - Kernel Mode Driver Framework Runtime, Microsoft Corporation
Total time spent in ISRs (%) 0.042628
ISR count (execution time <250 µs): 2237969
ISR count (execution time 250-500 µs): 0
ISR count (execution time 500-999 µs): 40
ISR count (execution time 1000-1999 µs): 0
ISR count (execution time 2000-3999 µs): 0
ISR count (execution time >=4000 µs): 0
_________________________________________________________________________________________________________
REPORTED DPCs
_________________________________________________________________________________________________________
DPC routines are part of the interrupt servicing dispatch mechanism and disable the possibility for a process to utilize the CPU while it is interrupted until the DPC has finished execution.
Highest DPC routine execution time (µs): 3853.598319
Driver with highest DPC routine execution time: Wdf01000.sys - Kernel Mode Driver Framework Runtime, Microsoft Corporation
Highest reported total DPC routine time (%): 0.761210
Driver with highest DPC total execution time: Wdf01000.sys - Kernel Mode Driver Framework Runtime, Microsoft Corporation
Total time spent in DPCs (%) 0.823047
DPC count (execution time <250 µs): 5512346
DPC count (execution time 250-500 µs): 0
DPC count (execution time 500-999 µs): 5481
DPC count (execution time 1000-1999 µs): 1
DPC count (execution time 2000-3999 µs): 281
DPC count (execution time >=4000 µs): 0
_________________________________________________________________________________________________________
REPORTED HARD PAGEFAULTS
_________________________________________________________________________________________________________
Hard pagefaults are events that get triggered by making use of virtual memory that is not resident in RAM but backed by a memory mapped file on disk. The process of resolving the hard pagefault requires reading in the memory from disk while the process is interrupted and blocked from execution.
NOTE: some processes were hit by hard pagefaults. If these were programs producing audio, they are likely to interrupt the audio stream resulting in dropouts, clicks and pops. Check the Processes tab to see which programs were hit.
Process with highest pagefault count: microsoft.photos.exe
Total number of hard pagefaults 2745
Hard pagefault count of hardest hit process: 1630
Number of processes hit: 23
_________________________________________________________________________________________________________
PER CPU DATA
_________________________________________________________________________________________________________
CPU 0 Interrupt cycle time (s): 192.369334
CPU 0 ISR highest execution time (µs): 364.676471
CPU 0 ISR total execution time (s): 4.390349
CPU 0 ISR count: 2234924
CPU 0 DPC highest execution time (µs): 3853.598319
CPU 0 DPC total execution time (s): 83.983974
CPU 0 DPC count: 5182006
_________________________________________________________________________________________________________
CPU 1 Interrupt cycle time (s): 128.824142
CPU 1 ISR highest execution time (µs): 571.095798
CPU 1 ISR total execution time (s): 0.110169
CPU 1 ISR count: 2017
CPU 1 DPC highest execution time (µs): 927.660504
CPU 1 DPC total execution time (s): 1.840566
CPU 1 DPC count: 85394
_________________________________________________________________________________________________________
CPU 2 Interrupt cycle time (s): 109.846842
CPU 2 ISR highest execution time (µs): 311.825210
CPU 2 ISR total execution time (s): 0.028665
CPU 2 ISR count: 1068
CPU 2 DPC highest execution time (µs): 656.609244
CPU 2 DPC total execution time (s): 0.159966
CPU 2 DPC count: 14824
_________________________________________________________________________________________________________
CPU 3 Interrupt cycle time (s): 67.841627
CPU 3 ISR highest execution time (µs): 0.0
CPU 3 ISR total execution time (s): 0.0
CPU 3 ISR count: 0
CPU 3 DPC highest execution time (µs): 304.331092
CPU 3 DPC total execution time (s): 1.350155
CPU 3 DPC count: 214533
_________________________________________________________________________________________________________
CPU 4 Interrupt cycle time (s): 49.240377
CPU 4 ISR highest execution time (µs): 0.0
CPU 4 ISR total execution time (s): 0.0
CPU 4 ISR count: 0
CPU 4 DPC highest execution time (µs): 209.054622
CPU 4 DPC total execution time (s): 0.051137
CPU 4 DPC count: 5839
_________________________________________________________________________________________________________
CPU 5 Interrupt cycle time (s): 34.164084
CPU 5 ISR highest execution time (µs): 0.0
CPU 5 ISR total execution time (s): 0.0
CPU 5 ISR count: 0
CPU 5 DPC highest execution time (µs): 232.242857
CPU 5 DPC total execution time (s): 0.015038
CPU 5 DPC count: 7745
_________________________________________________________________________________________________________
CPU 6 Interrupt cycle time (s): 38.097940
CPU 6 ISR highest execution time (µs): 0.0
CPU 6 ISR total execution time (s): 0.0
CPU 6 ISR count: 0
CPU 6 DPC highest execution time (µs): 255.854622
CPU 6 DPC total execution time (s): 0.020803
CPU 6 DPC count: 5274
_________________________________________________________________________________________________________
CPU 7 Interrupt cycle time (s): 43.402676
CPU 7 ISR highest execution time (µs): 0.0
CPU 7 ISR total execution time (s): 0.0
CPU 7 ISR count: 0
CPU 7 DPC highest execution time (µs): 193.361345
CPU 7 DPC total execution time (s): 0.027127
CPU 7 DPC count: 2494
_________________________________________________________________________________________________________
geposted Mon 08 Jun 20 @ 9:22 pm


